Population

A man pushes a baby in a stroller in Stockholm. Sweden has instituted generous paternity leave provisions as part of a policy to encourage more people to have children.
photo from Flickr/myglesias
Malthusian Fears [link]
In 1798, the British parson Thomas Malthus published the first edition of a book titled An Essay on the Principle of Population that was to become highly influential in the debate over human population (Malthus 1826). In Malthus's day, the populations of western European societies and their settler colonies like the United States were rapidly growing (see Figure 1). Many of Malthus's contemporaries believed that such population growth would be a good thing, and would help lead to a future utopia. Growing numbers of people represented economic success and prosperity. Malthus countered by arguing that population growth would inevitably force the majority of humanity into poverty.
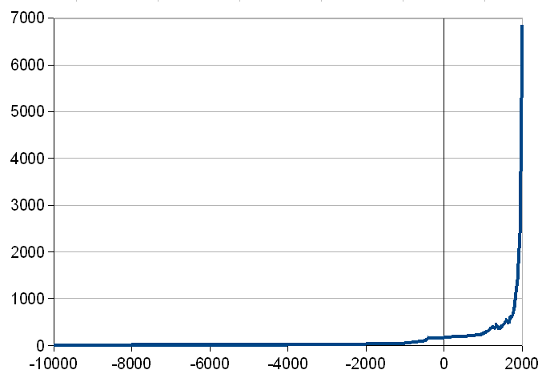
Figure 1: World population, 10,000 BCE to present. (vertical scale is in millions of people)
data from U.S. Census Bureau's International Data Base (10,000 BCE-1950 CE, 1950 CE-2010 CE)
Malthus's position can be summed up in the expression "food supply grows arithmetically, but population grows geometrically." This is illustrated in Figure 2. Arithmetic growth means that something grows by the same amount in each time interval. Noting that the world's supply of farmable land was finite, and that improving its output is difficult, Malthus concluded that a steady growth rate was the best the world could hope for in terms of increasing the food supply. But each person needs at least a certain minimum amount of food (at least 2,000 calories per day for most people (FAO 2010)) to survive. So there will be a crisis if the population outstrips the food supply. Malthus believed that it would, because population grows geometrically -- that is, at an ever-increasing rate. Imagine, for example, if we have one woman in our first generation. If she has two daughters, then our population grows to 3. If each of them has two daughters, our population is now 7. Even if the original woman dies before her great-grandchildren are born, the population size will still grow to 14. No matter how big the arithmetically-growing food supply, geometrically growing population will eventually catch up to it.
But would a population continue growing geometrically just because it can? Malthus believed the answer was yes. After all, he reasoned, children are produced by having sex, and people enjoy having sex. The only thing that can motivate would-be parents to abstain from sex is fear that they will not be able to feed the child that may result. Thus, when the food supply is adequate, population will increase rapidly. It is only when population has grown so much that there is barely enough food to go around that people will limit their family size. Malthus concluded that the majority of humanity is doomed to live on the edge of starvation. Any breakthrough that increased the food supply, or any disaster that decreased the population, would only temporarily postpone the inevitable march toward overpopulation.
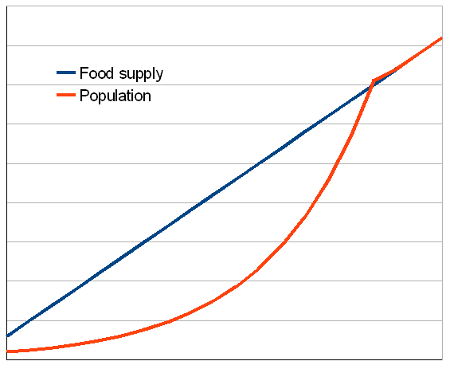
Figure 2: Malthus's theory. Horizontal scale represents time, vertical scale represents volume of food production and consumption.
based on Malthus 1826
Malthus's concerns were revived in the middle of the 20th century by a group of ecologically-minded writers who feared that not only food, but all natural resources, would soon run out as a result of population growth. They predicted that the world was sitting on a "population bomb," and that without drastic action there would be widespread famines and a collapse of industrial society (Ehrlich 1971, Meadows et al. 1972). These thinkers are commonly referred to as neo-Malthusians. Opposed to the neo-Malthusian position are thinkers known as cornucopians. According to cornucopians, human ingenuity can overcome any natural constraint, and thus human well-being will continue to increase as we find new technologies for using our resources (Simon 1998). It is interesting to note that Malthus was a conservative, who concluded from his theory that welfare and charity were futile because they would just encourage the poor to have more children, while his opponents were utopian socialists. On the other hand, the neo-Malthusians were mostly from the environmentalist left, while their cornucopian critics espoused a right-wing faith in the free market.
In 1980, the neo-Malthusian writer Paul Ehrlich made a bet with cornucopian Julian Simon over the price of five metal resources (copper, chromium, nickel, tin, and tungsten). Ehrlich thought they would get more expensive over the coming decade, indicating increased scarcity, while Simon predicted their prices would drop. In 1990, all five metals were cheaper than they had been in 1980, and so Ehrlich had to pay out $576.07 (Regis 1997). A bet on a short time scale covering only a few resources hardly conclusively proves the correctness of the cornucopian position. But it does prompt us to look more closely at the claims of Malthus and his more recent followers.
The Demographic Transition [link]
There are three points at which one might question Malthus's theory: the growth of food (or other resource) supply may be more rapid than Malthus imagined, the growth of population may be slower, or the amount of food (or other resources) needed per person may shrink (Harvey 1974). In this chapter we will focus mostly on the second issue. What factors might lead a population not to grow geometrically?
Looking at the long-term graph of world population (Figure 1), it appears that Malthus was on to something. We see a long period of very slow population growth, which becomes much more rapid over time, booming in the last two centuries. The world population was only 500 million in 1492, reaching one billion by 1804. Each successive billion people has been added more quickly than the last -- 123 years to 2 billion, 33 years to 3 billion, 14 years to 4 billion, 13 years to 5 billion, and 12 years to 6 billion. (US Census 2010). The world population reached 7 billion in late 2011 (El Nasser 2011).
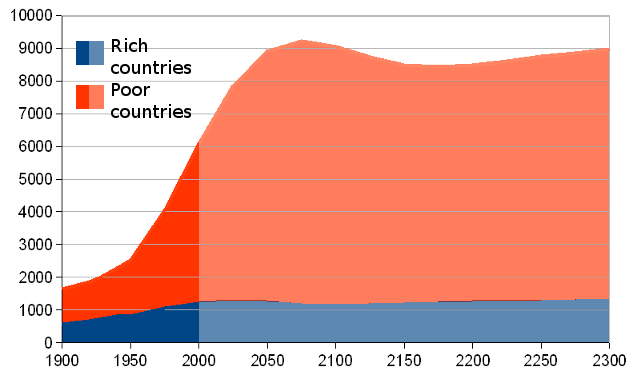
Figure 3: World population, 1900 CE to 2300 CE. (Lighter colored area is projected, darker color is actual data)
data from United Nations 2004 and Livi-Bacci 1992
But if we zoom in on the 20th century, the picture looks more complex. We can see the rapid growth rate slowing after the middle part of the century. Indeed, world population growth peaked at 2.2% per year in 1962. While the population is still growing, it is doing so more slowly than in the past. And when we look out at demographers' projections (shown in Figure 2), we see that within the next century it is expected that the world's population will plateau at 9 to 10 billion people (United Nations 2004). That is an awful lot of people -- possibly too many. But it is not the runaway geometric population growth that Malthus feared.
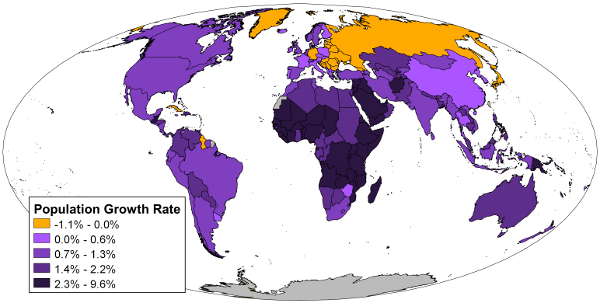
Moreover, if we look at where the current population growth is occurring, we see just the opposite of what Malthus envisioned. According to Malthus, population growth would only slow when people were so impoverished they knew they wouldn't be able to provide for an additional child. If people had adequate food supplies, they would be unrestrained in their reproduction. But looking at Figure 4, we can see that the global pattern of population growth has just the opposite relationship to food supply and wealth. It is the rich, well-fed countries like western Europe and Japan where population growth has slowed or even reversed. Meanwhile, poor countries like sub-Saharan Africa are experiencing rapid population growth.
To explain how the world's actual population trajectory differs from Malthus's predictions, we can turn to a theory called the "demographic transition model" (Livi-Bacci 1992), shown in Figure 5. The demographic transition is an explanation of how populations change as countries go through industrialization. We can think of industrialization as the application of technology to expand production of commodities and raise the overall material standard of living of people. At the time Malthus was writing, the industrial revolution was just beginning in Western Europe and North America. It has since spread to most areas of the world. Following industrialization, countries go through a common pattern of population growth and stabilization.
Changes in population are the result of four factors:
Birth rate: The number of people born over a certain interval (usually a year).
Death rate: The number of people who die over that interval.
Immigration: The number of people who move into the region of interest from elsewhere.
Emigration: The number of people who move out of our region of interest.
Combining these four factors, we can write out an equation for the change in population (Livi-Bacci 1992):
Population at time 2 = population at time 1 + births - deaths + immigration - emigration
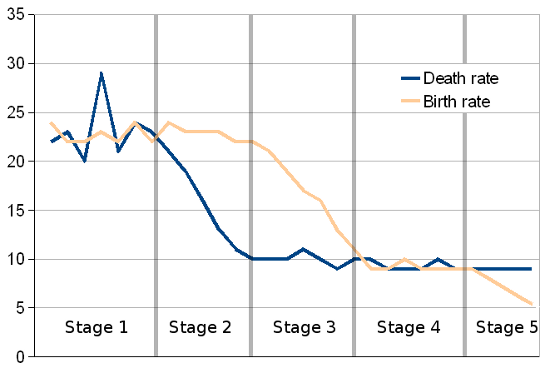
Figure 5: The demographic transition in a hypothetical country (vertical scale is in annual deaths or births per 1,000 population)
based on Livi-Bacci 1992
The demographic transition model focuses on the birth rate and the death rate. It sets to one side the issue of immigration and emigration, though we will see in the next chapter that migration into and out of an area can play a major role in shaping its population.
The first stage of the demographic transition is the pre-industrial era. During this phase, both birth and death rates are high. There are many causes of death in pre-industrial societies, particularly for children under 5 years old. This is balanced by large numbers of births, leading to a stable or slowly growing population.
As industrialization begins, the death rate drops rapidly in stage 2. New technologies allow many common causes of death to be greatly reduced or eliminated. The most notable of these is improvements in sanitation and hygiene. Access to clean water, made possible by the greater material wealth of industrializing societies, enables diseases like cholera to be wiped out. Advances in medical science play a smaller, but still notable, role. Meanwhile, the birth rate remains high. All of the cultural ideals about the importance of large families that made sense in the pre-industrial era persist, leading families to continue to produce large numbers of children. The net effect of a decreased death rate and constant birth rate is a boom in population, as more people are being added than are leaving.
In the third stage of the demographic transition, the death rate flattens out. All of the easy causes of death have been dealt with. Now societies are confronted with tough ones like cancer, so progress in reducing deaths slows. At the same time, the birth rate begins to drop. The causes of this drop can be summed up as economics and feminism. In this context, economics means that children go from being an economic boon to an economic burden. In a pre-industrial or early industrial society, children could begin working on the farm at an early age, contributing to the family's wealth. And as the parents aged, they depended on their surviving children to provide for them. Mature industrialization alters the organization of work. Child labor laws exclude children from work in factories and other jobs. Meanwhile, private pensions and investment accounts, and government programs like the US's Social Security, provide economic support for retirees that does not depend on having children of one's own. Thus, children become an economic liability rather than an economic boon to parents, discouraging them from having large families. Feminism refers to improvements in the status of women. When women secure more opportunities for education and employment, they on average choose to have fewer children. The success of gender equality movements gives women more options in life than producing children, and enables women to exercise more control over their reproduction when they have sex (e.g. through the use of birth control). Improvements in the status of women can have a dramatic effect on population growth. Within India, for example, the states with the lowest population growth rates are those that have the highest female literacy rates (Sen 2002). The overall effect of the declining birth rate and stabilizing death rate is a slow-down in the population growth rate in stage 3.
In stage 4 of the demographic transition, the declining birth rate meets the declining death rate. In the original formulation of the demographic transition model, it was expected that these two rates would remain about equal, producing a stable -- but now much larger -- population. However, some countries seem to be experiencing a fifth stage, in which birth rates continue to fall, leading to a shrinking population. For example, Italy's birth rate has been lower than its death rate since 1994 and the gap has grown ever since (US Census 2010). Italian population growth is now negative, and is projected to continue to be negative for the foreseeable future.
The various countries of the world are at different stages of the demographic transition today -- and within countries, some regions may be at different stages than others. The projections of a leveling-off of global population are based on a prediction that all countries will eventually complete the demographic transition, reaching the stable stage 4 or declining stage 5.
Policy Responses [link]
Both population growth (in stages 2 and 3 of the demographic transition) and population decline (in stage 5) have prompted government policy responses. Most government population policy today is aimed at stabilizing the population, avoiding either rapid population growth or population shrinkage.
Countries facing the possibility of rapid population growth may choose some combination of coercive or non-coercive population policies (Sen 2002). Non-coercive policies aim to educate people and give them more choices. Expanding access to general education (especially for girls), targeted sex education for people of all ages, propaganda praising small families, and increasing access to birth control have all been used to encourage and enable people to choose to have fewer children. Coercive policies aim to take away people's ability to have additional children. One common coercive policy has been forced sterilization. In the US in the early 20th century, and later in poor countries like India, doctors, governments, and other organizations have tried to bribe or trick women (particularly poor, disabled, and/or ethnic minority women) into being sterilized to prevent further pregnancy. The most famous coercive population-limiting policy is China's "One Child" policy. Starting in 1979, the government decreed that couples were only allowed to have one child each (with exceptions for ethnic minorities, rural people, and parents of twins, among others) (Livi-Bacci 1992). The policy was enforced through fines and workplace demotions against parents, as well as cases of forced abortion. Since that time, China has moved rapidly toward stage 4 of the demographic transition, but there is much debate over how much of the slowdown in population growth was due to the One Child policy, and how much was due to the increase in wealth and women's rights that occurred at the same time (Sen 2002).
Countries facing declining populations may choose to focus on one or both of the positive variables in the population equation: increasing births or increasing immigration. We will learn more about migration in the next chapter. This route is politically difficult, as the immigrants would mostly be coming from poor and rapidly-growing countries with very different cultures from the receiving country. Policies to increase births generally focus on reducing the economic cost of childrearing (Murphy 2006). Many European countries have mandated generous maternity and paternity leave policies, subsidized day care, and given tax incentives to people who have children, in order to make raising a child more feasible and enticing.
Famine and Entitlements [link]
As mentioned above, even if population growth is not as rapid as Malthus would suggest, it is possible that slower population growth will still bring about too large a population to feed. Figure 6 gives a good indication that we are not, at present, facing down a global Malthusian food crisis. Despite massive population growth over the last century, per capita food supplies have actually increased. That is, there is more food supply per person today than 50 years ago when neo-Malthusian fears were growing. The specific causes of this increase, particularly the "Green Revolution," will be discussed in our chapter on agriculture. The important question for us here is, if food supplies are growing, why is there still famine in the world? The UN estimates that 800 million people today have inadequate nutrition (FAO 2010).
Just because there is enough food to go around doesn't mean that food will actually go around. Economist Amartya Sen argues that we should think in terms of entitlements to food. An entitlement is anything that gives a person the ability to acquire food (Sen 1981). Entitlements may include money to buy food, land to grow it on, or kinship obligations that allow you to ask others for food. Famine is caused when a large number of people lose their entitlements to food, which can happen even if there is lots of food available. For example, if a flood wipes out the cotton crop, cotton farmers will not be able to earn any money to buy food with, and may therefore starve -- even if the rice farmers had a bumper crop that year. Or consider the case of recent corn prices in Mexico (Roig-Franzia 2007). Due to the North American Free Trade Agreement, corn supplies can move easily across the border in response to economic conditions. Starting in 2006, manufacturers of ethanol in the United States began to greatly increase their demand for corn (in response to policies promoting ethanol as a more climate-friendly alternative to gasoline). Because of this increased demand, corn prices in both countries rose. Many poor Mexicans now were unable to afford corn -- their entitlement had shrunk due to rising prices. The Mexican government faced major protests, and was forced to implement a price cap to make corn affordable for the poor.
Works Cited [link]
Ehrlich, Paul R. 1971. The Population Bomb. Cuthogue, N.Y.: Bucaneer.
El Nasser, Haya. 2011. World population hits 7 billion. USA Today, October 31.
FAO. 2010. Food Security Statistics.
Harvey, David. 1974. Population, resources, and the ideology of science. Economic Geography 50 (3): 256-277.
Livi-Bacci, Massimo. 1992. A Concise History of World Population. Cambridge, MA: Blackwell.
Malthus, Thomas Robert. 1826. An Essay on the Principle of Population: Or a View of Its Past and Present Effects on Human Happiness; with an Inquiry Into Our Prospects Respecting the Future Removal or Mitigation of the Evils Which It Occasions. London: John Murray.
Meadows, Donella H., Dennis L. Meadows, Jorgen Randers, and William W. Behrens III. 1972. The Limits to Growth. New York: Universe Books.
Murphy, Clare. 2006. The EU's baby blues. BBC News, March 27.
Regis, Ed. 1997. The Doomslayer. Wired, Feburary 5.
Roig-Franzia, Manuel. 2007. A culinary and cultural staple in crisis: Mexico grapples with soaring prices for corn -- and tortillas. The Washington Post, January 27.
Sen, Amartya. 1981. Ingredients of famine analysis: availability and entitlements. Quarterly Journal of Economics 96 (3): 433-464.
Sen, Amartya. 2002. Delusion and reality. Asian Affairs 17.
Simon, Julian. 1998. The Ultimate Resource II.
United Nations. 2004. World Population to 2300. United Nations: New York.
US Census Bureau. 2010. International Data Base.